Your cart is currently empty!
Finding the CSFs through a ‘sphere of influence’ mapping process
By David Parmenter
The “sphere of influence” process is a derivative of the BSC cause-and-effect and is a faster process. The aim of the “sphere of influence” process is to understand and document relationships between success factors e.g., late planes will lead to a loss of customers (both key and non-key customers), late maintenance, low staff satisfaction, poor utilization of planes etc.
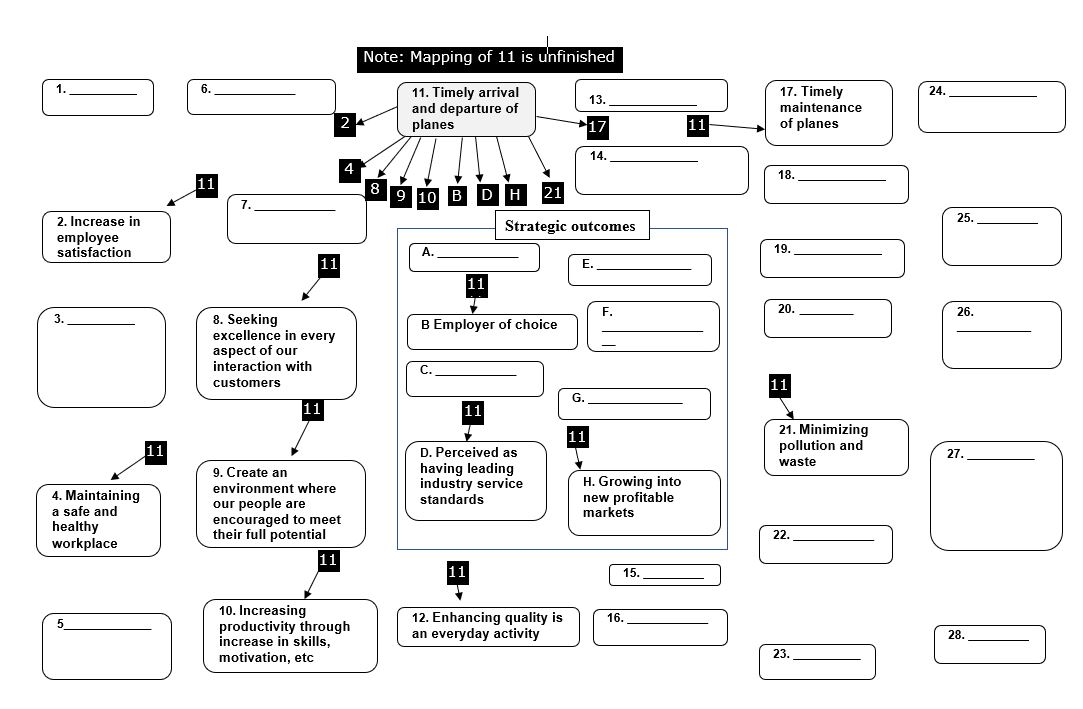
To find your five to eight operational CSFs, a good technique is to type all your success factors into numbered boxes on a large sheet of paper (A3/U.S. fanfold), as set out in Exhibit 1. Each team of five to seven people is then asked to map the sphere of influence of each success factor. We insert an arrow to reflect the direction of influence.
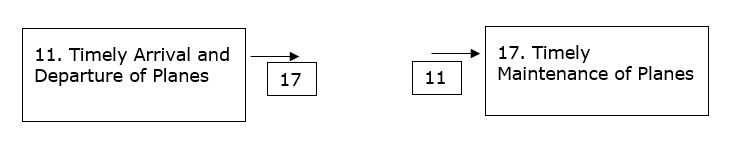
The mapping process is performed by the team members, starting with one success factor, and then looking at each other success factor and asking, “Does it impact this success factor?” To handle the number of relationships (in most organisations, you will be handling between 30-40 success factors). Draw short arrows with the number of the box it is going to, and then another arrow entering that box with the number of the box it has come from, see Exhibit 2. The key point to check is the direction.
EXHIBIT 1 Sphere of Influence Mapping Exercise (extract from the CSFs implementation guide)
It is understandable that some relationships are two-way. In these cases, we draw another set of arrows, traveling in opposite directions when we are mapping the other success factor.
EXHIBIT 2 Mapping Sphere of Influence (extract from the CSFs implementation guide)
I always give the following instructions:
- If one member of the team sees a linkage, other members of the team should draw the relationship without debate. This will speed up the process.
- Although the magnitude of the relationships will clearly be different, teams should pretend they are all equal for the time being.
- Each team should mentally jump into one success factor box at a time and look out at the other success factors, drawing the relationships they find.
- As in Exhibit 2 There is a two-way relationship. It is important not to get diverted for when you draw the arrows from “Timely Maintenance of Planes” to “Timely Arrival and Departure of Planes” you have effectively left your success factor and are examining another.
- After a couple of success boxes have been mapped and there is a common understanding of the exercise, each group should split into smaller teams of two or three people, each looking into a designated number of success factors.
There is an alternative method of mapping relationships, shown to me at an in-house workshop I was running. A clever attendee demonstrated how to map the relationships on a spreadsheet matrix, see Exhibit 7.4. This method is preferred by some and also creates easy to review documentation of the process. I now ask all workgroups to choose whatever method they prefer. The attendees using sphere of influence mapping are asked to have one team member to document their finding on the spreadsheet as well.
This exercise is slow to start with and then becomes quicker as teams remember where the success factors are positioned. It is also very subjective, and it is more applicable to participants who know the organisation well.
Purchase my latest implementation guides which are on sale (over 40% reduction):
How to implement winning KPIs (180 page Whitepaper + electronic templates)
Finding your Organization’s Critical Success Factors – implementation guide (Whitepaper 115 pages+ electronic templates)
and buy the Database of Measures and Associated Success Factors 4th Edition